The open analytics template is a very lightweight and reusable automation pipeline for open analytics projects. The tech stack is built using an end-to-end open-source tooling, consisting four key components:
- GitHub API / GitLab API: We use the open API to pull data from open health repositoiries as
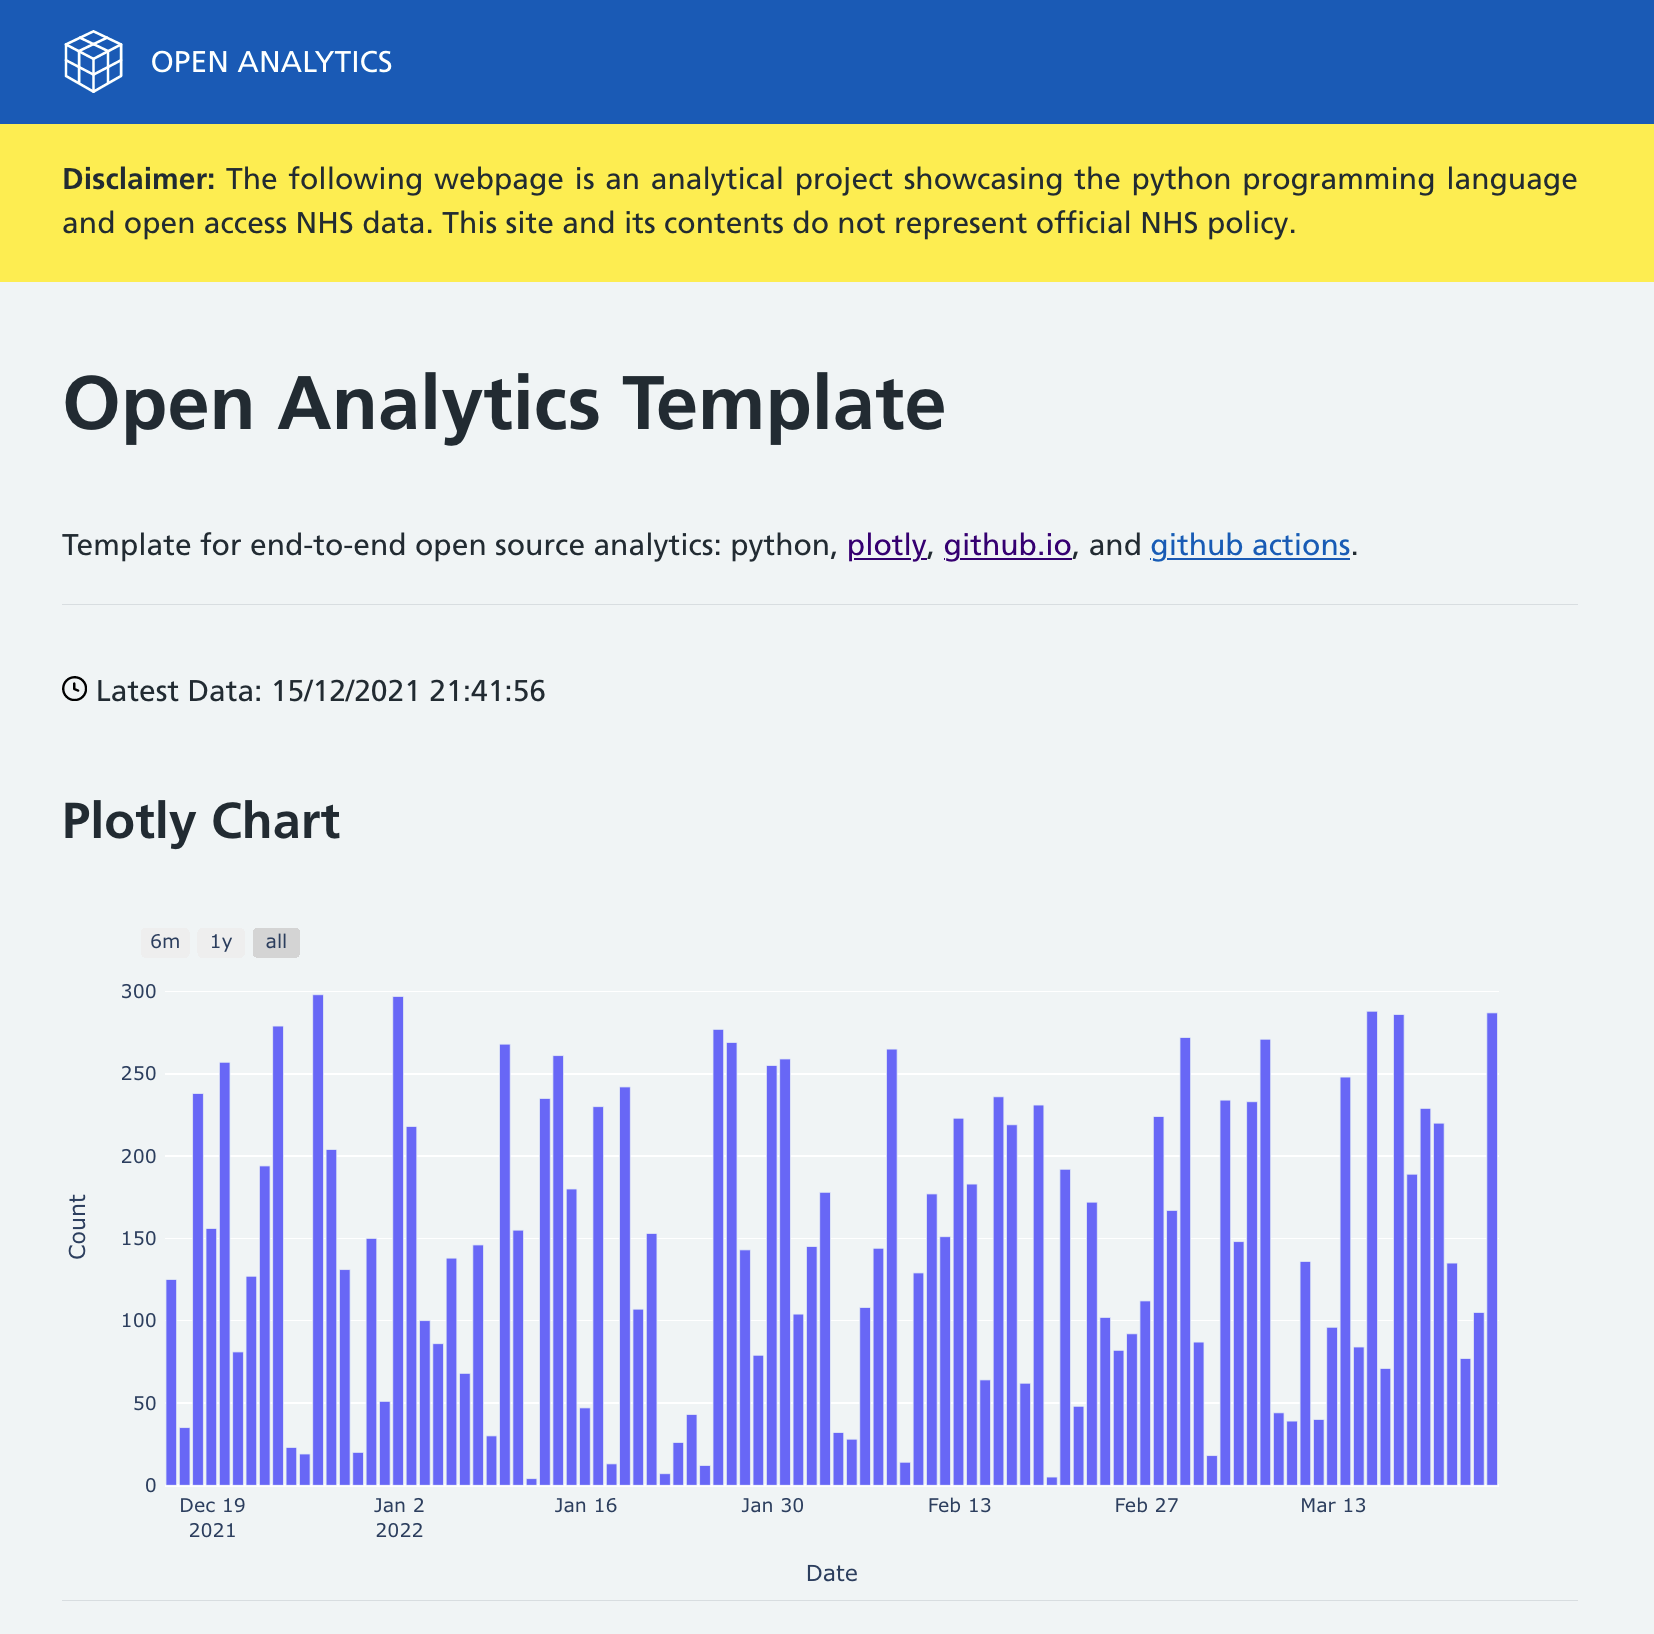
.jsonfiles that are flattened intopandasdataframes for analysis. - Plotly.py: An open source python graphing library is used to plot the repository data as tables and interactive charts.
- GitHub Actions: Used to orchestrate and automate the first two components on a schedule and commit those changes back to the project’s repository.
- GitHub.io Pages: We host and publish the results of our analysis to a static website that is re-built on every new commit.
The template is used to build and deploy the following projects:
- The Open-Source Health Statistics project was created by developers at NHSX and NHS Business Services Authority
Github / GitLab API
An API (Application Program Interface) allows us to access web tools or data in the cloud. The Github / GitLab API’s are designed so that we can create and manage our repositories, branches, issues, pull requests programmatically. Typically you would need to sign into your own account to access these features, but some information is publicly available. In this project we are using the API to access publicly available information on open source repositories published by NHS and health related organisations.
We use the urllib.request python library to access the API as follows:
url = (
        "https://api.github.com/orgs/"  # github REST call
        + org_id                        # organisation github name
        + "/repos?page="                # list of open repos
        + str(page)                     # page count
        + "&per_page=100"               # no of results per page
      )
Note: you can only make 60 calls per hour to the publich GitHub API, so we need to bear this in mind when looping through the API calls.
The outputs of the API call returns a .json file from which we can flatten to a panads dataframe.
flat_data = pd.json_normalize(data)We can then do some basic calculations to summerise these data. For example, count the number of repositores by each organisation.
aggregate = (
    df.groupby(["org", "date"])
    .sum()
    .reset_index()
)
Plotly
Plotly is a free and open source graphing library that that supports over 40 interactive, publication-quality graphs. It is available in Python, R, and JavaScript although the rendering process uses the Plotly.js JavaScript library under the hood.
We use Plotly to save the graph to standalone HTML files.
# example plotly chart syntax
import plotly.graph_objects as go
cols=['A', 'B', 'C','D', 'E', 'F']

fig = go.Figure([go.Bar(x=cols, y=[6, 14, 33, 23, 9, 2])])
fig.show()
# write out to file (.html)
plotly_example = plotly.offline.plot(
fig, include_plotlyjs=False, output_type="div", config=config
)
with open("_includes/plotly_example.html", "w") as file:
file.write(plotly_example)Example Ploty Graph
Github Actions
GitHub Actions are a way to automate workflows using a simple YAML syntax. It’s free on public repositories.
You must store workflow files in the .github/workflows directory of your repository.
Requred
name:The name of your workflow. GitHub displays the names of your workflows on your repository’s actions page.
on: [push, pull_request]Required. The name of the GitHub event that triggers the workflow. For a list of available events, see Events that trigger workflows.
You can schedule a workflow to run at specific UTC times using POSIX cron syntax. Scheduled workflows run on the latest commit on the default or base branch.
on:
  schedule:
    #runs at 00:00 UTC everyday
    - cron: "0 0 * * *"
This example triggers the workflow every day at 00:00 UTC:
Jobs
A workflow run is made up of one or more jobs. Each job runs in a fresh instance of a virtual environment specified by runs-on.
| Virtual environment | YAML workflow label |
|---|---|
| Windows Server 2019 | windows-latest or windows-2019 |
| Windows Server 2016 | windows-2016 |
| Ubuntu 20.04 | ubuntu-latest or ubuntu-20.04 |
| Ubuntu 18.04 | ubuntu-18.04 |
| macOS Big Sur 11 | macos-11 |
| macOS Catalina 10.15 | macos-latest or macos-10.15 |
Steps
Checkout: This action checks-out your repository so the workflow can access it.
- name: checkout repo content
uses: actions/checkout@v2
Setup python: This action sets up a Python environment for use in actions by installing and adding to PATH an available version of Python in this case python 3.8
- name: setup python
uses: actions/setup-python@v2
with:
    python-version: 3.8
Install dependancies: This GitHub Action installs Python package dependencies from a user-defined requirements.txt file path with pip
- name: Install Python dependencies
uses: py-actions/py-dependency-install@v2
with:
    path: "requirements.txt"
In this case plotly, pandas, and pyYaml
# requirements.txt
plotly==4.14.3
pandas==1.1.3
pyyaml==5.4.1
Runs command-line programs using the operating system’s shell. run the run.py to get the latest data
- name: execute py script
run: |
    python run.py
        dir
Commit changes to files
- name: Commit files
id: commit
run: |
    git config --local user.email "action@github.com"
    git config --local user.name "github-actions"
    git add --all
    if [-z "$(git status --porcelain)"]; then
        echo "::set-output name=push::false"
    else
        git commit -m "Add changes" -a
        echo "::set-output name=push::true"
    fi
shell: bash
Push changes to repo so github pages will re-build website
- name: Push changes
if: steps.commit.outputs.push == 'true'
uses: ad-m/github-push-action@master
with:
    github_token: }
GitHub Pages
GitHub Pages is a static site hosting service that takes HTML, CSS, and JavaScript files straight from a repository on GitHub, optionally runs the files through a build process, and publishes a website.
You can use a static site generator to build your site for you or publish any static files that you push to your repository as follows:
- On GitHub, navigate to your site’s repository, example: https://nhs-pycom.github.io/opensource-health-statistics/.
- In the root of the repository, create a new file called
index.mdthat contains the content for your site. - Under your repository name, select
Settings. - In the left sidebar, select
Pages. - Select the branch from which to publish your page and select
save. - Your page will be deployed within 60 seconds
- To see your published site, under
GitHub Pages, select your site’s URL.
For the Open Health Statistics page we are using a static version of the NHS Digital Service Manual that meets the GOV.UK service standard.